Call us at 1-888-GTCOMM1


Iotop is a top-like program with a focus on input/output, or I/O for short. It monitors what input or output is currently happening on your machine, helping you to quickly identify problematic issues of disk usage. Iotop is an open-source Python program licensed under the GNU General Public License.
Getting started
You’ll need the following to proceed with this guide:
• 1 Node (Cloud Server or Dedicated Server) running Ubuntu 16.
• Root access to the server
Tutorial
Installation is a simple process. The iotop utility is located in the offical repositories, so grab the package from there.
apt-get update && apt-get install iotop
Now you can simply run iotop and instantly see what’s happening with your system.
iotop
In this example, the server is idle. No issues here!
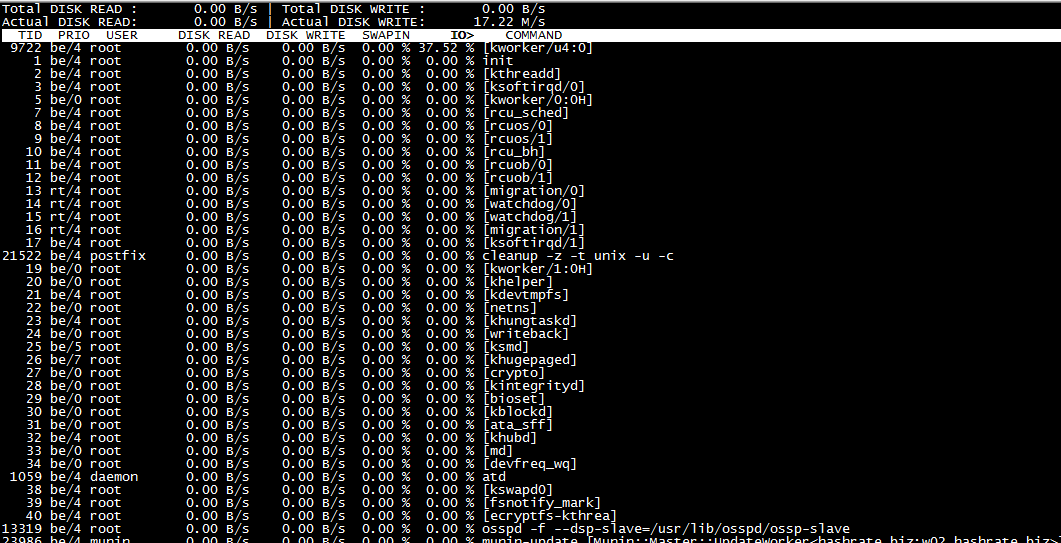
The applications that use the most resources will appear at the top of the list. To judge how much bandwidth a program is using, compare its I/O value with the total amount of disk read or write. You can also take a look at the SwapIn column, which indicates the amount of swap activity per process.
You can run iotop with more precise commands, such as this one which tells it to only check disk global disk usage data.
root@iotop:~# iotop -btoqq --iter=1

17:53:54 Total DISK READ :       0.00 B/s | Total DISK WRITE :       0.00 B/s

17:53:54 Actual DISK READ:       0.00 B/s | Actual DISK WRITE:       0.00 B/s
This will show you the global disk usage and any application that consumes disk bandwidth. However, iotop will only give you this report if no specific program is consuming a large amount of resources.
When an application begins to have more disk activity, you will see the process appear in the output.
root@iotop:~# iotop -btoqq --iter=5

17:55:00 Total DISK READ :       0.00 B/s | Total DISK WRITE :       0.00 B/s

17:55:00 Actual DISK READ:       0.00 B/s | Actual DISK WRITE:       0.00 B/s

17:55:01 Total DISK READ :       0.00 B/s | Total DISK WRITE :       0.00 B/s

17:55:01 Actual DISK READ:       0.00 B/s | Actual DISK WRITE:       0.00 B/s

17:55:02 Total DISK READ :       0.00 B/s | Total DISK WRITE :      98.57 K/s

17:55:02 Actual DISK READ:       0.00 B/s | Actual DISK WRITE:     220.79 K/s

17:55:02   142 be/3 root        0.00 B/s   55.20 K/s  0.00 %  0.20 % [jbd2/sda3-8]

17:55:02 21522 be/4 postfix     0.00 B/s    3.94 K/s  0.00 %  0.06 % cleanup -z -t unix -u -c

17:55:02 23849 be/4 postfix     0.00 B/s    0.00 B/s  0.00 %  0.00 % local -t unix

17:55:02 31183 be/4 mysql       0.00 B/s   11.83 K/s  0.00 %  0.00 % mysqld

17:55:02   470 be/4 syslog      0.00 B/s   19.71 K/s  0.00 %  0.00 % rsyslogd [rs:main Q:Reg]

17:55:03 Total DISK READ :       0.00 B/s | Total DISK WRITE :     772.34 K/s

17:55:03 Actual DISK READ:       0.00 B/s | Actual DISK WRITE:     985.80 K/s

17:55:03 12082 be/4 nagios      0.00 B/s  461.85 K/s  0.00 %  0.20 % nagios -d /usr/local/nagios/etc/nagios.cfg

17:55:03   142 be/3 root        0.00 B/s  252.27 K/s  0.00 %  0.05 % [jbd2/sda3-8]

17:55:03 31215 be/4 mysql       0.00 B/s   58.22 K/s  0.00 %  0.00 % mysqld
Here’s another command that shows you only the top resource-hogging applications. It checks 5 iterations of the iotop instance and attempts to locate the top consumers.
root@iotop:~# iotop -botqqq --iter=5

17:59:50 24333 be/4 root        0.00 B/s    0.00 B/s  0.00 %  0.48 % [kworker/u4:2]

17:59:51 12082 be/4 nagios      0.00 B/s    3.91 K/s  0.00 %  0.00 % nagios -d /usr/local/nagios/etc/nagios.cfg

17:59:52   142 be/3 root        0.00 B/s   66.50 K/s  0.00 %  0.31 % [jbd2/sda3-8]

17:59:52 12082 be/4 nagios      0.00 B/s  465.48 K/s  0.00 %  0.16 % nagios -d /usr/local/nagios/etc/nagios.cfg

17:59:52  5604 be/4 postfix     0.00 B/s    3.91 K/s  0.00 %  0.00 % tlsmgr -l -t unix -u -c
You may wish to send iotop’s output to a logfile. Use the following command:
crontab -e
Once in your crontab configuration, add the line below. Make sure that you adjust it depending on your needs. For this task, we’ll log specific applications so that we can identify the top resource users over time using different parsing techniques on the logfiles.
* * * * * root iotop -botqqq --iter=3 >> /var/log/iotop
Save your crontab file. After a minute or so, you should see the logs in /var/log/iotop.
Conclusion
As you can see, Iotop is a versatile program that you can use in a number of ways to help keep your disk usage to an acceptable level. We highly recommend using it for systems where you’ve detected unexplained lags in performance. If this guide was helpful to you, kindly share it with others who may also be interested.