Call us at 1-888-GTCOMM1


How to Install and Use Iotop on Ubuntu 14
Iotop is a tool that complements top. Whereas top monitors CPU load, iotop monitors input and output (I/O). Iotop provides information regarding the total disk read and write bandwidth in use, the read and write bandwidth consumed by each process and the swap activity per process. By default, it presents active processes in an ordered list by I/O usage. Alternatively, iotop can track accumulated read, write, and swap bandwidth used. In either mode, it can help identify processes that are not stressing the CPU but are nonetheless creating a performance bottleneck by driving a high level of I/O activity. The present tutorial describes how to install and use iotop on an Ubuntu 14.04 server.
Getting Started
To complete this guide, you will need the following:
• 1 Node (Cloud Server or Dedicated Server) running Ubuntu 14.
Install
In order to install iotop from the official repositories, you must run the following command:
apt-get update && apt-get install iotop
Now that the installation is finished, we can now explore Iotop features.
Explore the Features of Iotop
A few simple commands are all that you need to learn to take advantage of the full range of capabilities built into iotop.
Our first test will be to run it without any options turned on.
iotop
You will see a list of processes running on your server. Unless you were deliberately running a process that demands a lot of I/O bandwidth, your output probably indicates the server’s hard drive and swap space was largely idle, much like the example here:
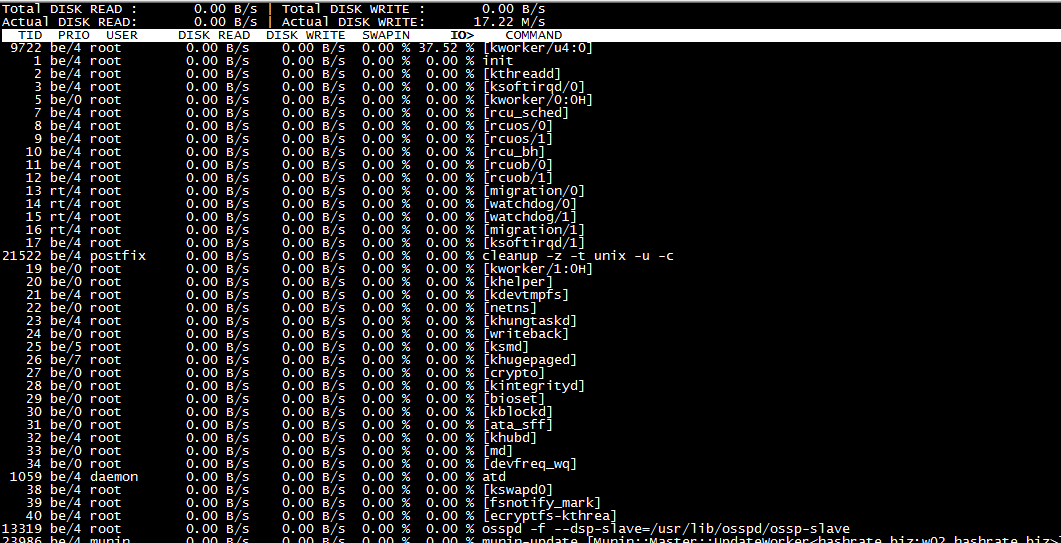
Any process that is consuming a lot of I/O resources immediately gets placed at the top of the list. In this mode, iotop provides a continuous update of the instantaneous I/O bandwidth consumed by each process.
The SwapIn column in iotop provides data regarding the swap activity per process. Along with the read and write columns, iotop thereby provides a full accounting of all I/O activity on the server each time it samples the system.
The command options provide the means for more precisely controlling the information it collects and displays. For instance, if you are interested in checking the accumulated disk usage data by process and thread since iotop was initiated, this command will get you what you want:
root@iotop:~# iotop -btoqq --iter=1
17:53:54 Total DISK READ :       0.00 B/s | Total DISK WRITE :       0.00 B/s

17:53:54 Actual DISK READ:       0.00 B/s | Actual DISK WRITE:       0.00 B/s
This mode allows you to easily compare the IO% value of each of the most demanding active processes and threads with the total amount of read and write activity on the disk to determine the I/O bandwidth each process is consuming over whatever time interval you choose to sample. The larger the number of iterations you set the longer the time interval the final output will represent. This command also tells iotop to ignore applications that are not consuming significant I/O resources.
If an application’s I/O demands increase above the minimum threshold during the time iotop is sampling you will see its process in the output.
root@iotop:~# iotop -btoqq --iter=5
17:55:00 Total DISK READ :       0.00 B/s | Total DISK WRITE :       0.00 B/s

17:55:00 Actual DISK READ:       0.00 B/s | Actual DISK WRITE:       0.00 B/s

17:55:01 Total DISK READ :       0.00 B/s | Total DISK WRITE :       0.00 B/s

17:55:01 Actual DISK READ:       0.00 B/s | Actual DISK WRITE:       0.00 B/s

17:55:02 Total DISK READ :       0.00 B/s | Total DISK WRITE :      98.57 K/s

17:55:02 Actual DISK READ:       0.00 B/s | Actual DISK WRITE:     220.79 K/s

17:55:02   142 be/3 root        0.00 B/s   55.20 K/s  0.00 %  0.20 % [jbd2/sda3-8]

17:55:02 21522 be/4 postfix     0.00 B/s    3.94 K/s  0.00 %  0.06 % cleanup -z -t unix -u -c

17:55:02 23849 be/4 postfix     0.00 B/s    0.00 B/s  0.00 %  0.00 % local -t unix

17:55:02 31183 be/4 mysql       0.00 B/s   11.83 K/s  0.00 %  0.00 % mysqld

17:55:02   470 be/4 syslog      0.00 B/s   19.71 K/s  0.00 %  0.00 % rsyslogd [rs:main Q:Reg]

17:55:03 Total DISK READ :       0.00 B/s | Total DISK WRITE :     772.34 K/s

17:55:03 Actual DISK READ:       0.00 B/s | Actual DISK WRITE:     985.80 K/s

17:55:03 12082 be/4 nagios      0.00 B/s  461.85 K/s  0.00 %  0.20 % nagios -d /usr/local/nagios/etc/nagios.cfg

17:55:03   142 be/3 root        0.00 B/s  252.27 K/s  0.00 %  0.05 % [jbd2/sda3-8]

17:55:03 31215 be/4 mysql       0.00 B/s   58.22 K/s  0.00 %  0.00 % mysqld
The following command is built to sample 5 iterations of the iotop instance and to identify the applications demanding the most I/O resources during the measured interval:
root@iotop:~# iotop -botqqq --iter=5
17:59:50 24333 be/4 root        0.00 B/s    0.00 B/s  0.00 %  0.48 % [kworker/u4:2]

17:59:51 12082 be/4 nagios      0.00 B/s    3.91 K/s  0.00 %  0.00 % nagios -d /usr/local/nagios/etc/nagios.cfg

17:59:52   142 be/3 root        0.00 B/s   66.50 K/s  0.00 %  0.31 % [jbd2/sda3-8]

17:59:52 12082 be/4 nagios      0.00 B/s  465.48 K/s  0.00 %  0.16 % nagios -d /usr/local/nagios/etc/nagios.cfg

17:59:52  5604 be/4 postfix     0.00 B/s    3.91 K/s  0.00 %  0.00 % tlsmgr -l -t unix -u -c
The above commands provide the means to visually monitor I/O bandwidth usage on the server. Iotop can also be used to monitor and log disk usage. Thus, it can track which processes are consuming disk resources at all times.
To create a log file that retains a complete record of I/O usage on your server you will need to create a crontab job:
crontab -e
Once you are in the crontab configuration, add the lines below. The specific options you use will depend on your needs. In our example, we have configured the job so that the log will only include data from applications that are using significant I/O resources.
* * * * * root iotop -botqqq --iter=3 >> /var/log/iotop
Once you have selected the options you want, save the crontab file. Wait a short time and then check the logs in /var/log/iotop to make sure the crontab job is working.
You will be able to identify the applications that consume the most I/O bandwidth over whatever time period you wish by using different parsing techniques and fine tuning the crontab job.
Conclusion
You have now installed iotop on your Ubuntu 14.04 server. Just as top helps to track down memory leaks, now this new tool will help to track down unwanted or unexpected I/O activity. If this guide was helpful to you, kindly share it with others who may also be interested.