Call us at 1-888-GTCOMM1


How to Install and Use Iotop on CentOS 7
Hard drive performance is often a bottleneck when diagnosing why a server may be running more slowly. Maybe a program is performing lots of writes, or numerous swap hits are causing performance to degrade. Regardless of the cause, iotop is a critical tool in determining if excessive disk access is degrading server resources. In this guide, we’ll install iotop on CentOS 7, and will introduce its use so you’ll know how to instrument production servers.
Getting Started
To complete this guide, you will need the following:
• 1 Node (Cloud Server or Dedicated Server) running a clean CentOS 7.
• Root access to the server.
While it will work on a production server, it is recommended that you familiarize yourself with iotop on an instance that isn’t critical to your operations before using this knowledge on a live system.
Tutorial
Let’s begin. The iotop package is included in the official CentOS 7 package repositories, so we only need to install it.
yum -y install iotop
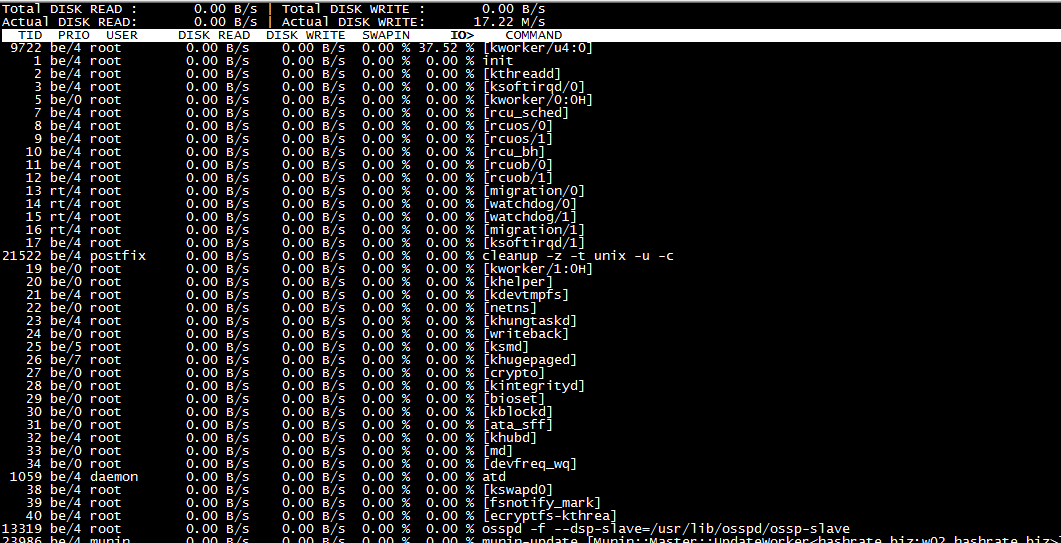
Now we run the newly-installed iotop command, at which point we’ll get regularly updated statistics on disk use.
iotop
At the moment the iotop results aren’t terribly interesting. If you’ve followed this guide’s recommendation, you’ve installed it on a server that is mostly idle.
If an application is performing many disk reads or writes, you’ll notice it at the top of the list. You can use the IO percentage value to determine a program’s disk access as it relates to total drive bandwidth. If a program is behaving badly, there may be configuration tweaks that can be made to reduce its disk use, perhaps making it rely more on RAM.
The SwapIn column lets you determine how much a given process is hitting swap. This may be an indication that the process’s memory use should be reduced somehow. While it would still be writing to disk, letting a process persist storage using its own mechanisms is likely faster than having it page memory in and out of swap.
If the current iotop display is too coarse, there are ways to run it that display more precise details. For instance, maybe you only want global disk usage data. The following command accomplishes this:
root@iotop:~# iotop -btoqq --iter=1
17:53:54 Total DISK READ :       0.00 B/s | Total DISK WRITE :       0.00 B/s

17:53:54 Actual DISK READ:       0.00 B/s | Actual DISK WRITE:       0.00 B/s
You can also run iotop with multiple iterations. This gives you more snapshots of disk usage, giving a more accurate picture of how disk bandwidth is being used.
root@iotop:~# iotop -btoqq --iter=5
17:55:00 Total DISK READ :       0.00 B/s | Total DISK WRITE :       0.00 B/s

17:55:00 Actual DISK READ:       0.00 B/s | Actual DISK WRITE:       0.00 B/s

17:55:01 Total DISK READ :       0.00 B/s | Total DISK WRITE :       0.00 B/s

17:55:01 Actual DISK READ:       0.00 B/s | Actual DISK WRITE:       0.00 B/s

17:55:02 Total DISK READ :       0.00 B/s | Total DISK WRITE :      98.57 K/s

17:55:02 Actual DISK READ:       0.00 B/s | Actual DISK WRITE:     220.79 K/s

17:55:02   142 be/3 root        0.00 B/s   55.20 K/s  0.00 %  0.20 % [jbd2/sda3-8]

17:55:02 21522 be/4 postfix     0.00 B/s    3.94 K/s  0.00 %  0.06 % cleanup -z -t unix -u -c

17:55:02 23849 be/4 postfix     0.00 B/s    0.00 B/s  0.00 %  0.00 % local -t unix

17:55:02 31183 be/4 mysql       0.00 B/s   11.83 K/s  0.00 %  0.00 % mysqld

17:55:02   470 be/4 syslog      0.00 B/s   19.71 K/s  0.00 %  0.00 % rsyslogd [rs:main Q:Reg]

17:55:03 Total DISK READ :       0.00 B/s | Total DISK WRITE :     772.34 K/s

17:55:03 Actual DISK READ:       0.00 B/s | Actual DISK WRITE:     985.80 K/s

17:55:03 12082 be/4 nagios      0.00 B/s  461.85 K/s  0.00 %  0.20 % nagios -d /usr/local/nagios/etc/nagios.cfg

17:55:03   142 be/3 root        0.00 B/s  252.27 K/s  0.00 %  0.05 % [jbd2/sda3-8]

17:55:03 31215 be/4 mysql       0.00 B/s   58.22 K/s  0.00 %  0.00 % mysqld
You can also have iotop only report an application if it is using an excessive amount of resources. This filters out apps that aren’t likely to be causing issues. If an app begins using large amounts of resources, it will appear in iotop’s output.
Similarly, you can have iotop only output the top applications currently consuming disk bandwidth. This command takes five samples of disk usage, displaying only the top applications that are hitting the disk.
root@iotop:~# iotop -botqqq --iter=5
17:59:50 24333 be/4 root        0.00 B/s    0.00 B/s  0.00 %  0.48 % [kworker/u4:2]

17:59:51 12082 be/4 nagios      0.00 B/s    3.91 K/s  0.00 %  0.00 % nagios -d /usr/local/nagios/etc/nagios.cfg

17:59:52   142 be/3 root        0.00 B/s   66.50 K/s  0.00 %  0.31 % [jbd2/sda3-8]

17:59:52 12082 be/4 nagios      0.00 B/s  465.48 K/s  0.00 %  0.16 % nagios -d /usr/local/nagios/etc/nagios.cfg

17:59:52  5604 be/4 postfix     0.00 B/s    3.91 K/s  0.00 %  0.00 % tlsmgr -l -t unix -u -c
If you know that disk use on your server is heavy but can’t watch iotop constantly, it can be used to output a log of disk use in the background. The log can then be checked later to identify problematic applications. This command will log iotop output for later analysis:
crontab -e
When editing your crontab, add the below line. Edit the line to suit your needs. This example logs only certain applications for later investigation.
* * * * * root iotop -botqqq --iter=3 >> /var/log/iotop
Save this file and wait a minute for it to run. You’ll see logs in /var/log/iotop.
Conclusion
Iotop is a complex tool with many possible uses, but it is invaluable in determining whether disk access is causing performance issues on your server. The above should help you both identify individual issues, as well as set up longer-term performance monitoring to spot intermittent disk usage spikes that might hobble your server. If this guide was helpful to you, kindly share it with others who may also be interested.