 Call us at 1-888-GTCOMM1
-

- Dedicated Hosting
- Cloud hosting
- Services
- Support
- Learning Center
- Referral Program
- Français
-
Why globotech
- Log in
CentOS, short for Community Enterprise Operating System, is a Linux distribution that is free, community-supported, and enterprise-class; CentOS is designed to be usable in organizations or enterprises. CentOS 7, the operating system being used in this guide, was released in 2015 and is the current major release of this software.
To help manage the different web servers an organization may use that have CentOS installed the CentOS WebPanel was created. Web Panel offers a free control panel that provides easy supervision of dedicated and virtual private servers; Web Panel removes the need for users to use the ssh (secure shell) console for each action, providing a more user-friendly interface with a variety of options.
In this guide, we are using CentOS 7, which was first released in August of 2015. You will need a node running on a cloud server or dedicated server, and it needs to have CentOS 7 already installed.
Additionally, you will need at least one (1) dedicated IP address and a valid domain name to function as your hostname during the installation. A dedicated IP address is a unique address that is assigned to a single hosting account; using a dedicated address allows you to view the site via the IP address and provides faster response times even during high traffic loads.
Once you have a virtual or dedicated installation of CentOS 7, an IP address, and a valid domain name, you’re ready to start installing CentOS WebPanel.
The first step to installing Web Panel is verifying that your CentOS 7 installation is updated and running the most recent version of the software. The CentOS Project website provides additional details about current releases, upcoming changes, and release notes; you can verify your CentOS version number with the current release listed on the project website.
To verify that your operating system is current, you can run the following command:
yum update -y && sleep 5 && reboot
Once you’ve run any necessary updates, it’s time to set your hostname and verify that the hostname resolves to your dedicated IP address:
hostnamectl set-hostname server.example.com
After assigning the hostname and verifying it resolves to your IP address, make sure that you meet the requirements for the installation script with the following command:
yum install wget -y
When verification is complete, you can proceed with the Web Panel installation script:
cd /usr/local/src

wget http://centos-webpanel.com/cwp-el7-latest

sh cwp-el7-latest
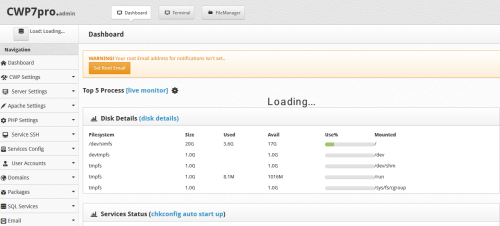
Wait for the installation to complete, and then it’s time to check the success of your Web Panel install. You can access the control panel at http://SERVER-IP:2030/, replacing “SERVER-IP” with your IP address.
Your username will be “root,” and your password will be your selected root password.
Username: root

Pass: Your root password.
Congratulations, you’re installed the CentOS 7 WebPanel and are ready to start using your control panel instead of an ssh console. In this guide, we’ve walked through the steps to install the Web Panel on your node running CentOS 7. If you found this guide helpful during the process, please share it with other users walking through the same process.
Nagios is a free Unix software that allows you to monitor systems, networks, and infrastructure. It offers both monitoring and alerting services for configured servers, switches, applications, and services. One of the most useful features of Nagios is its double alert system. Not only will the user receive an alert when one of the monitored objects first encounters an error, a second alert will be given when the problem has been resolved. Nagios is a useful software that will give any system administrator some peace of mind when managing their systems, and can be installed on all Linux distributions. Thanks to the extensive capabilities of Nagios, it can even provide other benefits along with its traditional monitoring services such as reduced server downtime and resulting business loss prevention, assistance for IT upgrades and upgrade planning, and security breach detection.
This guide will cover how to install Nagios on Ubuntu 14.
In order to complete this tutorial, you will need the following:
• 1 server (Cloud Server or Dedicated Server) running Ubuntu 14
Before proceeding, you will also need to ensure that you are able to execute commands as root. This means that you should either be able to login as the root user, or ideally, execute root commands under a user with superuser privileges.
Nagios requires certain prerequisite packages which we can install using the default package manager utility for Ubuntu 14, apt-get. Execute the following command as root. You can either be logged in as the root user, or when using an account with superuser priviliges, append the command sudo to the start of the line.
apt-get install wget build-essential libgd2-xpm-dev apache2-utils unzip
To run Nagios, you will also need to have the Apache web server and PHP. The Apache HTTP server is the most popularly used open-source multi-platform web server, providing the full range of web features such as CGI, SSL, and virtual domains. PHP, which stands for PHP: Hypertext Preprocessor, is another popular open-source tool and is a scripting language that is especially suited for web development. Install Apache and PHP (as well as some prerequisite packages) with apt-get:
apt-get install apache2 php5 php5-mysql php5-gd libgd-dev libapache2-mod-php5
When Apache is installed, you will need to make some modifications to its configuration in order for the web server to be able to handle PHP. First, we will need to modify the serving preferences of Apache. By default, Apache will look for a file called index.html in the webroot directory /var/www/html/. However, we want it to serve instead the index.php file, even if the HTML file is also present. We can easily modify the preferences of Apache by opening the configuration file from /etc/apache2/mods-enabled/dir.conf using the text editor nano:
nano /etc/apache2/mods-enabled/dir.conf
With the file open, you will see the following:
<ifmodule mod_dir.c="mod_dir.c">

DirectoryIndex index.html index.cgi index.pl index.php index.xhtml index.htm

</ifmodule>
This file dictates the preference order of Apache web server, and the most preferred files are found to the left, with the least preferred on the right. We will need to move index.php from its current place in the middle of the list to the leftmost side, coming immediately before index.html. The modified final file should look as follows:
<ifmodule mod_dir.c="mod_dir.c">

DirectoryIndex index.php index.html index.cgi index.pl index.xhtml index.htm

</ifmodule>
Save the file and close nano when you are finished. Next, restart Apache for the changes to take into effect:
service apache2 restart
To run Nagios, you will need to create a specific user to serve as the Nagios user. You can easily create a new user with the useradd command, which will create a user with whichever name is specified after the command (in this case “nagios”). Execute the following as root:
useradd -m nagios
After entering the user creation command, you will need to provide the user with a password. Execute the passwd command and when prompted, enter the new password.
passwd nagios
Next, create the “nagcmd” group for Nagios. This will allow external commands to be submitted through the web interface. We will add both the Nagios user and the Apache user to the group. The usermod command will allow us to modify various details of a user, such as the group.
groupadd nagcmd

usermod -a -G nagcmd nagios

usermod -a -G nagcmd www-data
To actually install Nagios, you will first to obtain some information about the latest stable release versions from the Nagios downloads page. Check both the versions of Nagios Core and the Nagios Plugins, you will need them. While Nagios Core will provide the base functionality above, the Plugins package is required in order to best take advantage of the Nagios offering by allowing you to monitor hosts, devices, services, protocols, and applications. At the time of writing, the latest stable release of Nagios Core is 4.2.1 and Nagios Plugins is 2.1.2. The following command, which uses the web utility wget, will then download the Nagios Core and Plugins files. Replace the respective version numbers with the latest numbers if they have changed.
wget https://assets.nagios.com/downloads/nagioscore/releases/nagios-4.2.1.tar.gz

wget http://www.nagios-plugins.org/download/nagios-plugins-2.1.2.tar.gz
The previous step will have downloaded two archived TAR files to whichever directory you executed the command in. To unarchive the files so that you can use them, use the command tar with the options xzf to extract (x the files, filter the archive through gzip (z, and output the new unpacked directory with the same file name (f). First, start with the Nagios Core:
tar xzf nagios-4.2.1.tar.gz
Next, change to the new unpacked directory:
cd nagios-4.2.1/
To compile and install Nagios, you will need to build it from source using make. Execute all of the following commands in the Nagios directory as the superuser. Don’t forget to append sudo to the beginning of each command if you are not directly signed in as root.
./configure --with-command-group=nagcmd

make all

make install

make install-init

make install-config

make install-commandmode
When the above make commands have completed, you will need to finally install the Nagios web interface using:
make install-webconf
There is a chance that you will receive the following error when installing the web interface:
/usr/bin/install -c -m 644 sample-config/httpd.conf /etc/httpd/conf.d/nagios.conf

/usr/bin/install: cannot create regular file ‘/etc/httpd/conf.d/nagios.conf’: No such file or directory

Makefile:296: recipe for target 'install-webconf' failed

make: *** [install-webconf] Error 1
This issue occurs if Nagios tries to create its configuration file, nagios.conf, inside the /etc/httpd.conf/ directory. However, this file should instead be in the /etc/apache2/sites-enabled directory. We can ensure that the configuration file is placed in the correct directory by executing the following command in place of make install-webconf as root:
/usr/bin/install -c -m 644 sample-config/httpd.conf /etc/apache2/sites-enabled/nagios.conf
After the web interface installation completes, double check that the configuration file is where it should be using ls, which will list files in a given directory:
ls -l /etc/apache2/sites-enabled/
To log into the Nagios web interface, you will have to create a new administrative user account called nagiosadmin. You will use this to log into the Nagios web interface, so remember the password that you provide for this account. Create the user with:
sudo htpasswd -c /usr/local/nagios/etc/htpasswd.users nagiosadmin
Restart the Apache web server for the changes made to take into effect with the service command, which allows you to manage all system services:
service apache2 restart
With Nagios and its web interface installed, you will need to then configure the Nagios account to set up the correct email address where you would like to receive alerts. Edit the /usr/local/nagios/etc/objects/contacts.cfg configuration file with the nano text editor to modify the email address associated with the nagiosadmin contact definition:
nano /usr/local/nagios/etc/objects/contacts.cfg
With the file open in nano, search for the following section of code. Locate the field called email in the contact definition for nagiosadmin. When you have found the correct section, edit the field to your email.
[...]

define contact{

contact_name nagiosadmin ; Short name of user

use generic-contact ; Inherit default values from generic-contact template (defined above)

alias Nagios Admin ; Full name of user

email

}

[...]
Save and close the file when you are finished editing.
Now, we are ready to unzip and install the Nagios Plugins. In the directory where you downloaded the TAR archives, unarchive the plugins file nagios-plugins-2.1.2.tar.gz using tar xzf:
tar xzf nagios-plugins-2.1.2.tar.gz
When the unarchiving is done, change to the newly created plugin directory with the command cd:
cd nagios-plugins-2.1.2/
In the plugin directory, execute the following three commands to compile and install the Nagios Plugins:
./configure --with-nagios-user=nagios --with-nagios-group=nagios

make

make install
You can easily check if your configuration files have any errors with the following command executed with superuser privileges:
/usr/local/nagios/bin/nagios -v /usr/local/nagios/etc/nagios.cfg
If there are no configuration errors, you will now be able to start up Nagios. Start it using the service command. As a bonus, add Nagios to run on boot so that you will not need to do it manually each time.
service nagios start

ln -s /etc/init.d/nagios /etc/rcS.d/S99nagios
To verify the installation, access the Nagios interface at the following URL, replacing the text with the IP address of your Ubuntu 14 server:
http:///nagios
The login details will be nagiosadmin, with the password that you set above. The Nagios administration console will display a variety of details about Nagios, Nagios news, and your system upon successful login.
Congratulations! With Nagios set up on your Ubuntu 14 server, you can feel safer knowing that your system is now more secure. With the ability to receive double alerts on a variety of possible desired objects to monitor, your Ubuntu 14 server is better equipped for whatever may happen. Explore the Nagios web interface and the online documentation to see what features will best suit your needs, and if you enjoyed this tutorial, feel free to share it with your friends!
Nagios is a very popular server monitoring software application that’s been in development since 1999 and is still regularly updated. The server administrator who uses Nagios gains access to a wide variety of features such as SSH-enabled remote monitoring, network and host traffic monitoring, and a versatile plugin ecosystem. Nagios is free and open source under the GNU General Public License, version 2.
Before you begin, make sure you have the following prepared:
• 1 Remote server (Cloud Server or Dedicated Server) running CentOS 7.
• All commands should be run as the root user
The first step is to make sure that Selinux is disabled.
setenforce 0

sed -i 's/enforcing/disabled/' /etc/sysconfig/selinux

sed -i 's/enforcing/disabled/' /etc/selinux/config
Once you’ve done that, you’ll need to install some basic prerequisite packages for Nagios.
yum install gcc glibc glibc-common gd gd-devel net-snmp openssl-devel wget unzip nano -y
Let’s install the Apache webserver and PHP.
yum install httpd php php-cli -y
We’ll be adding a Nagios user to our system, along with nagcmd, so that Nagios and Apache can be integrated together.
useradd nagios

groupadd nagcmd

usermod -a -G nagcmd nagios

usermod -a -G nagcmd apache
Now, we’ll proceed with the installation of Nagios proper. This requires that you download Nagios and the Nagios plugins from the official site.
cd /tmp

wget https://assets.nagios.com/downloads/nagioscore/releases/nagios-4.2.1.tar.gz

wget https://nagios-plugins.org/download/nagios-plugins-2.1.2.tar.gz
Unzip the Nagios archive you downloaded and use the script inside to install the program.
tar -zxvf nagios-4.2.1.tar.gz

cd nagios-4.2.1/

./configure --with-command-group=nagcmd

make all

make install

make install-init

make install-config

make install-commandmode

make install-webconf
Open the contact file in your favorite text editor and change the enclosed email address to your own.
nano /usr/local/nagios/etc/objects/contacts.cfg
[...]

# This contact definition inherits a lot of default values from the 'generic-contact'

# template which is defined elsewhere.

define contact{

        contact_name                    nagiosadmin             ; Short name of user

        use                             generic-contact         ; Inherit default values from generic-contact template (defined above)

        alias                           Nagios Admin            ; Full name of user

        email                           nagios@localhost        ; <<***** CHANGE THIS TO YOUR EMAIL ADDRESS ******
        }
[...]
Now, set the password that you'll use to access Nagios.
htpasswd -c /usr/local/nagios/etc/htpasswd.users nagiosadmin
After that, you can unzip and install the Nagios plugins from the second archive you downloaded.
cd /tmp

tar -zxvf nagios-plugins-2.1.2.tar.gz

cd nagios-plugins-2.1.2/

./configure --with-nagios-user=nagios --with-nagios-group=nagios --with-openssl

make

make install
Just to be safe, check that your config file has no errors.
/usr/local/nagios/bin/nagios -v /usr/local/nagios/etc/nagios.cfg
Nagios Core 4.2.1

Copyright (c) 2009-present Nagios Core Development Team and Community Contributors

Copyright (c) 1999-2009 Ethan Galstad

Last Modified: 09-06-2016

License: GPL

Website: https://www.nagios.org

Reading configuration data...

   Read main config file okay...

   Read object config files okay...

Running pre-flight check on configuration data...

Checking objects...

        Checked 8 services.

        Checked 1 hosts.

        Checked 1 host groups.

        Checked 0 service groups.

        Checked 1 contacts.

        Checked 1 contact groups.

        Checked 24 commands.

        Checked 5 time periods.

        Checked 0 host escalations.

        Checked 0 service escalations.

Checking for circular paths...

        Checked 1 hosts

        Checked 0 service dependencies

        Checked 0 host dependencies

        Checked 5 timeperiods

Checking global event handlers...

Checking obsessive compulsive processor commands...

Checking misc settings...

Total Warnings: 0

Total Errors:   0

Things look okay - No serious problems were detected during the pre-flight check
The final step is to start up the Nagios and Apache daemons.
service httpd start

service nagios start
In order to access your Nagios interface, you can use the convenient web-based interface. This should be located at this URL:
http://your_ip/nagios/
Here's the login information that you can use the first time:
Login : nagiosadmin
Password : The password you set previously
Feel free to change the login name to something more obfuscated.
Now that you know how to install Nagios on your system, you can use it as a quick and simple, yet full-featured, monitoring tool for any system under your purview. If you found this article helpful, feel free to share it with your friends and let us know in the comments below!
Nagios is a proven monitoring solution for your IT infrastructure. If you run complex networks of services and hardware, many subtle problems might arise and remain undetected. Unfortunately, when the effects of these issues manifest, they usually do so in ways that negatively impact or take down critical services on which you depend for work or revenue. Often, spotting these issues in advance makes them easier to mitigate, and even when it doesn’t, it’s better to detect problems yourself than have your customers do so for you. If you run production infrastructure and are not monitoring it, then you should start doing so today. If unsure of what to use, it is difficult to go wrong with Nagios.
Before you begin, make sure you have the following prepared:
• 1 Remote server (Cloud Server or Dedicated Server) running Ubuntu 16
• All commands should be run as the root user
Begin by installing the basic packages on which Nagios depends.
apt-get install gcc unzip make
Nagios also needs the Apache web server and PHP programming language. Continue by installing both.
apt-get install apache2 php libapache2-mod-php php-mcrypt
Now that PHP is installed, you’ll need to tell Apache how to run scripts. Here we configure it to do so.
nano /etc/apache2/mods-enabled/dir.conf
By default, many PHP apps use the index.php script as an entrypoint. Ensure that index.php is listed first in the below line from your configuration file:
<IfModule mod_dir.c>

DirectoryIndex index.php index.html index.cgi index.pl index.xhtml index.htm

</IfModule>
Apache is now configured to run PHP scripts. Let’s restart it so the configuration changes take effect.
systemctl restart apache2.service
Next we’ll add a Nagios user for Apache, and for the nacmd utility.
useradd nagios

groupadd nagcmd

usermod -a -G nagcmd nagios

usermod -a -G nagcmd www-data
In order to get the latest Nagios, we’ll download it directly from the official site. We’ll also retrieve some of the more popular plugins you’ll likely want running in your installation.
cd /tmp

wget https://assets.nagios.com/downloads/nagioscore/releases/nagios-4.2.1.tar.gz

wget https://nagios-plugins.org/download/nagios-plugins-2.1.2.tar.gz
Unzip the archive you’ve just downloaded and install Nagios itself.
tar -zxvf nagios-4.2.1.tar.gz

cd nagios-4.2.1/

./configure --with-nagios-group=nagios --with-command-group=nagcmd --with-httpd_conf=/etc/apache2/sites-enabled/

make all

make install

make install-init

make install-config

make install-commandmode

make install-webconf
You’ll now need to edit the contact file, changing the email address to one that you monitor.
nano /usr/local/nagios/etc/objects/contacts.cfg
[...]

# This contact definition inherits a lot of default values from the 'generic-contact'

# template which is defined elsewhere.

define contact{

contact_name nagiosadmin ; Short name of user

use generic-contact ; Inherit default values from generic-contact template (defined above)

alias Nagios Admin ; Full name of user

email nagios@localhost ; <<***** CHANGE THIS TO YOUR EMAIL ADDRESS ******

}

[...]
Nagios needs a password to be set in order for you to access the web interface. Since monitoring is a critical aspect of your infrastructure, you’ll want to pick a strong password and keep it secure. Anyone who has access to Nagios can gain vital insight into how your systems are set up, and might use said knowledge to orchestrate attacks.
htpasswd -c /usr/local/nagios/etc/htpasswd.users nagiosadmin

a2enmod cgi

systemctl restart apache2.service
Next, unzip and install the archive containing Nagios’ plugins.
cd /tmp

tar -zxvf nagios-plugins-2.1.2.tar.gz

cd nagios-plugins-2.1.2/

./configure --with-nagios-user=nagios --with-nagios-group=nagios

make

make install
It is easy to make mistakes when editing the Nagios config file. Let’s ensure that it has no errors.
/usr/local/nagios/bin/nagios -v /usr/local/nagios/etc/nagios.cfg
Nagios Core 4.2.1

Copyright (c) 2009-present Nagios Core Development Team and Community Contributors

Copyright (c) 1999-2009 Ethan Galstad

Last Modified: 09-06-2016

License: GPL

Website: https://www.nagios.org

Reading configuration data...

Read main config file okay...

Read object config files okay...

Running pre-flight check on configuration data...

Checking objects...

Checked 8 services.

Checked 1 hosts.

Checked 1 host groups.

Checked 0 service groups.

Checked 1 contacts.

Checked 1 contact groups.

Checked 24 commands.

Checked 5 time periods.

Checked 0 host escalations.

Checked 0 service escalations.

Checking for circular paths...

Checked 1 hosts

Checked 0 service dependencies

Checked 0 host dependencies

Checked 5 timeperiods

Checking global event handlers...

Checking obsessive compulsive processor commands...

Checking misc settings...

Total Warnings: 0

Total Errors: 0

Things look okay - No serious problems were detected during the pre-flight check
Nagios does not ship a systemd unit file, a specification needed to start and stop Nagios. Create one with these contents.
nano /etc/systemd/system/nagios.service
[Unit]

Description=Nagios

BindTo=network.target

[Install]

WantedBy=multi-user.target

[Service]

User=nagios

Group=nagios

Type=simple

ExecStart=/usr/local/nagios/bin/nagios /usr/local/nagios/etc/nagios.cfg
With the unit file in place, we can now use systemd to enable Nagios to start on boot. We can also start it immediately.
systemctl enable /etc/systemd/system/nagios.service

systemctl start nagios.service
Nagios should be up and running. To check its status, access the built-in web interface. Visit http://your_ip/nagios/ to continue. The default credentials are “nagiosadmin” for the username, and your password set previously as the password.
That was easy. You’re now keeping tabs on this server with Nagios, and can detect many significant issues before they become critical. Many system administrators fail to be proactive about watching their servers, so share this article with anyone you know who isn’t sold on the need for good monitoring. If you found this article helpful, feel free to share it with your friends and let us know in the comments below!
iostat, short for input/output statistics, is a popular Linux system monitoring tool that allows users to identify a variety of performance issues as well as obtain CPU and system information from the collection of statistics it collects. These statistics, like the iostat name suggests, involve operating system storage input and output. As more than a statistics collection tool, the comprehensive overview that the iostat command provides is valuable for any system administrator.
This tutorial will cover installing and using iostat for yourself on a Linux server.
The completion of this tutorial requires the following:
• 1 Linux Server (Cloud Server or Dedicated Server)
The process of installing iostat is very simple. iostat is part of the sysstat package, which you can install on your respective system with one of the below commands. Linux iostat command to report CPU statistics and I/O statistics:
CentOS
yum install sysstat
Ubuntu / Debian
sudo apt-get install sysstat
The iostat tool is accessed via its command, iostat. Enter this command to see how it works:
iostat
Here is a sample output of the sort you will when you call the iostat command:
Linux 2.6.32x86_64 (dev-db) 01/01/2016

avg-cpu:  %user  %nice  %system  %iowait  %steal  %idle

           5.00    0.00    0.50    2.00    0.00    92.50

Device:  tps  Blk_read/s  Blk_wrtn/s  Blk_read   Blk_wrtn

sda     200.53   1022.33  1394.72    2214048305  3845623328

sda1    150.20    473.24  1422.29    1844686896  3295752889

sda2    20.00     320.12  145.21     1000012186  1668872653
While this report may, at first glance, look complicated, understanding what the report shows is actually fairly straightforward. We will explain, section by section, what each aspect of the iostat report entails so that you can easily use the reporting for yourself:
Section 1: the CPU report
Within the first part of the report (the area with percentage values), you will find the CPU statistics that iostat has collected. Here we break down for you the statistics that you will find, and what they mean. For related statistics, we have added a helpful summary in bold so that you can see what is involves at an overview:
Concerning CPU usage at the user/application level with and without nice priority, and at the system/kernel level:
%user: This column displays the percentage of CPU utilization that has occured during execution at the user/application level.
%nice: This column also displays the percentage of CPU utilization that occurs while executing at the user level, however this time with a nice priority. This means that only commands called with the Linux command nice, which lowers priority below the standard level, are shown in this statistic.
%system: In this column, you can see the percentage of CPU utilization that occured while executing at the system (also known as kernel) level, as opposed to the above statistics.
Concerning CPU idle and wait times:
%iowait: This statistic is the percentage of the time that the CPU or CPUs were idle during which the system had an outstanding disk I/O request.
%steal: The second to last column goes on to show the percentage of time spent in involuntary wait by the virtual CPU or CPUs while the hypervisor was servicing another virtual processor.
%idle: The last column in this section shows the percentage of time that the CPU or CPUs were idle and the system did not have an outstanding disk I/O (input/output) request.
Section 2: the device utilization report
The second portion of the iostat report, which is oftentimes larger than the first section, lists all devices and displays statistics that concern their usage. This section is read horizontally, with each row displaying the statistics for its respective device:
Device: The very first column is the one that shows the device or partition name as listed in the /dev directory is shown.
tps: This next column begins the statistics for the device, and displays the number of transfers per second (tps) that were issued to the device. A busier processor will have a higher number of these transfers.
Blk_read/s: This statistic, blocks read per second, shows the amount of data read from the device, as expressed in a number of blocks (e.g. kilobytes, megabytes) per second.
Blk_wrtn/s: Similarly, blocks written per second is shown with the amount of data written to the device also expressed in a number of blocks (e.g. kilobytes, megabytes) per second.
Blk_read: The total number of blocks read for each device are displayed in the second-to-last column.
Blk_wrtn: Likewise, the total number of blocks written is displayed, for each device, is in the last column.
1. Display megabytes instead of bytes
By default, iostat measures system input and output with the unit bytes. As bytes are so small, for easier comprehensibility by humans we can convert the report to instead display reports with megabytes, which are significantly larger and much easier to understand at first sight. Call iostat using the -m flag to display megabytes inside the reports:
iostat -m
Notice how the output now changes to show megabytes as desired, as seen in this sample output:
Linux 2.6.32x86_64 (dev-db) 01/01/2016

avg-cpu:  %user  %nice  %system  %iowait  %steal  %idle

           5.00    0.00    0.50    2.00    0.00    92.50

Device:  tps   MB_read/s MB_wrtn/s  MB_read  MB_wrtn

sda     200.53    0.62      0.74    1032680  1742461

sda1    150.20    0.29      0.64    1002131  1204562

sda2    20.00     0.17      0.14     393451   322456
2. Display extended status
While the original report still contains a lot of useful information, we can obtain even more information by using the flag -x with the iostat command in order to display extended reports:
iostat -x
The output of iostat will now also include extended disk I/O statistics information as shown in this sample below. Note that we have shown the output wrapped as the header information line for the device columns is very long in comparison to before:
Linux 2.6.32x86_64 (dev-db) 01/01/2016

avg-cpu:  %user  %nice  %system  %iowait  %steal  %idle

           5.00    0.00    0.50    2.00    0.00    92.50

Device:  rrqm/s  wrqm/s   r/s     w/s     rsec/s   wsec/s  \

sda     7684.00  19.00   2420.00  523.00  81848.00 5287.00  \

         avgrq-sz  avgqu-sz  await  svctm  %util

         29.86     32.99     11.17  0.34   100.00
To understand what the new extended columns mean, you can look in the man page for iostat either online or with the command:
man iostat
3. Run iostat with a delay
It is possible to tell iostat to take multiple reports with a delay known as the interval. This is done with a number parameter given to the iostat command. However, if only the interval parameter is given, then iostat will run continuously generating reports on that interval until you stop it! So we will also provide a second parameter known as the count parameter, which is also a number.
These are given to iostat in the form:
iostat [OPTIONS] [INTERVAL] [COUNT]
For an example situation where we want to generate three reports with a three-second interval between reports, and showing megabytes, run the command:
iostat -m 3 3
The last two numbers in the above command represent the interval parameter and the count parameter. The interval parameter, the first 3 in the example, tell iostat to wait three seconds between each report, with each subsequent report containing statistics for the time since the previous report. The count parameter, the second 3 in the example, tells iostat how many reports should be generated in total. Returning to our example, the output should now look similar to the following:
Linux 2.6.32x86_64 (dev-db) 01/01/2016

avg-cpu:  %user  %nice  %system  %iowait  %steal  %idle

           5.00    0.00    0.50    2.00    0.00    92.50

Device:  tps   MB_read/s MB_wrtn/s  MB_read  MB_wrtn

sda     200.53    0.62      0.74    1032680  1742461

sda1    150.20    0.29      0.64    1002131  1204562

sda2    20.00     0.17      0.14     393451   322456
Three seconds pass.
Linux 2.6.32x86_64 (dev-db) 01/01/2016

avg-cpu:  %user  %nice  %system  %iowait  %steal  %idle

           5.00    0.00    0.50    2.00    0.00    92.50

Device:  tps   MB_read/s MB_wrtn/s  MB_read  MB_wrtn

sda     200.53    0.62      0.74    1032680  1742461

sda1    150.20    0.29      0.64    1002131  1204562

sda2    20.00     0.17      0.14     393451   322456
4. Display only one report section
Iostat also lets you modify the report to show only the first CPU section or only the second disk section. To show only the CPU statistics, we can use the -c flag with iostat with the command:
iostat -c
We will use the example situation where we want to show the CPU section only, using a two-second interval, and display the information five times (that is, make five reports total with one report every two seconds for only the CPU section). For this, execute the following command:
iostat -c 2 5
The output will now look something like the following:
Linux 2.6.32x86_64 (dev-db) 01/01/2016

avg-cpu:  %user  %nice  %system  %iowait  %steal  %idle

           5.00    0.00    0.50    2.00    0.00    92.50
Two seconds pass.
Linux 2.6.32x86_64 (dev-db) 01/01/2016

avg-cpu:  %user  %nice  %system  %iowait  %steal  %idle

           5.00    0.00    0.50    2.00    0.00    92.50
Two seconds pass.
Linux 2.6.32x86_64 (dev-db) 01/01/2016

avg-cpu:  %user  %nice  %system  %iowait  %steal  %idle

           5.00    0.00    0.50    2.00    0.00    92.50
Two seconds pass.
Linux 2.6.32x86_64 (dev-db) 01/01/2016

avg-cpu:  %user  %nice  %system  %iowait  %steal  %idle

           5.00    0.00    0.50    2.00    0.00    92.50
Two seconds pass.
Linux 2.6.32x86_64 (dev-db) 01/01/2016

avg-cpu:  %user  %nice  %system  %iowait  %steal  %idle

           5.00    0.00    0.50    2.00    0.00    92.50
This guide has shown the basics of using the iostat system monitoring and statistics tool for your Linux system. More information about possible modifications to the reports can be found in the online man page for iostat in order to get the most you can out of them. If you found this introduction to iostat useful, share it with your friends!
DirectAdmin is a popular control panel for Linux and Unix. It’s designed for website administration via a graphical user interface that you can access over the web. It’s popular for shared hosting situations due to the ease with which users can access and change the settings for their individual sites.
It’s a paid service where you can pay for usage on a monthly, yearly or even lifetime basis. The main benefit of it being a paid service is the access to technical support, which helps a lot when issues crop up or you want to increase the security of your system, which is especially important if you’re running a shared hosting platform with many users.
Since DirectAdmin is proprietary software, you’ll need a license to run it. While there is an automated solution for updating your DirectAdmin license, it is sometimes not possible, in which case you’ll need to update it manually. Fear not, as it’s an extremely simple process on the same level as your distro’s standard package update command. We’ve compiled this short guide to walk you through the steps of getting your license updated.
In order to follow the steps for this guide, you’ll need these prequirements ready:
• A server (Cloud Server or Dedicated Server) with DirectAdmin installed
• A valid license key
• All commands must be entered in root
This guide is concerned with how to update or force the update of your Directadmin License. You’ll first need to obtain a valid key from directadmin.com, and the user ID that was assigned to the license. Naturally, the license should be registered and assigned to your server’s IP address.
Here’s a set of sample information that we’ll use in this guide:
• User ID : 1111
• License : 12345
• IP address : 123.123.123.2
Your first step is to change into your Directadmin directory.
cd /usr/local/directadmin/scripts
You’ll notice a handy script in this directory. This is the key to performing the manual update. Use the following command (remember to enter it as root!) to update your license.
./getLicense.sh [User ID] [License ID] [Server IP address]
./getLicense.sh 1111 1234 123.123.123.2
Now, the final step is to restart your DirectAdmin service.
service directadmin restart
Voila! Your DirectAdmin license should now be updated. As you can see, it’s a very easy process that doesn’t take much time, so don’t put it off when it comes time to update. If you found this article helpful, feel free to share it with your friends and let us know in the comments below!
FreeIPA® is an open-source security information management solution that has both a web interface and command-line administration tools. FreeIPA has many components including Kerberos, NTP, DNS, and Dogtag (a certificate system) in order to provide security on your CentOS 7 server. The full FreeIPA package essentially provides Linux systems with the abilities for centralized authentication, authorization and account information by storing data about user, groups, hosts and all the other objects that are needed to manage security for networks. With its multitude of administration options, FreeIPA is extremely easy to configure for your needs and simple to manage.
To get the FreeIPA suite of tools working for you, this tutorial will teach you how you can setup and configure a basic FreeIPA installation for your CentOS 7 system.

The completion of this tutorial requires the following:
• 1 Server (Cloud Server or Dedicated Server) running CentOS 7.
• All commands should be run as the root user
It is always good practice to ensure that your server is up to date before installing new packages. As the root user, update your CentOS 7 server using yum with the -y flag to avoid prompts for yes as shown:
yum update -y
Before we install FreeIPA, we have to take some basic steps to configure our machine to be ready. Install the package dependencies required for our setup with the following commands if they are not already installed:
yum install bind-dyndb-ldap ipa-server-dns sssd-client sssd-common sssd-common-pac sssd-ldap sssd-proxy python-sssdconfig authconfig authconfig-gtk
We also need to make sure that our server hostname can resolve to a valid IP address in order to be able to install and access FreeIPA. For the purposes of this tutorial, we will use 10.10.0.35 as our IP address for our server and ipa.tutorial.com as our url. Execute the following commands, replacing with your own IP and url:
echo 10.10.0.35 ipa.globo.tech ipa7 >> /etc/hosts

echo ipa.globo.tech > /etc/hostname
Now we are ready to install the actual FreeIPA server. Use yum again to install the necessary package. Don’t forget that all commands must be done as the root user:
yum install ipa-server -y
The setup process for FreeIPA can take a long time to complete depending on the server specifications. Begin the setup process with the following command:
ipa-server-install --setup-dns
This setup process executes the following steps: configures a stand-alone CA (dogtag) for certificate management, configures the Network Time Daemon (ntpd), creates and configures an instance of Directory Server, creates and configures a Kerberos Key Distribution Center (KDC), configures Apache (httpd), and configures DNS (bind). During the setup, you will be prompted with several questions regarding the server installation. Make sure to define the server hostname and domain name for DNS.
It is also at this point that you will setup the password for the IPA admin and directory manager during the installation. These passwords must be eight characters long. You will also be asked questions about the Kerberos realm. Usually, this will be the same as the domain name and are given in upper case letters. More about Kerberos is explained when obtaining its ticket in the next step.
When the process finally completes (which may be up to 30 minutes), it will provide some information about ports that must be opened which will be done in the following step, but first we must obtain a Kerberos ticket. The Kerberos server is a basic component of FreeIPA and provides authentication services for FreeIPA and all of its components. The Kerberos ticket is essentially a temporary pass-book to authenticate with Kerberos and allows us to use the IPA tools with the user interface. Obtain the admin ticket:
kinit admin
You can see your tickets at any time with the below command, which will also show expiry dates:
klist
Now to complete the installation, allow firewall access to the specified ports as follows:
TCP Ports:
• 80 – 443: HTTP/HTTPS
• 389 – 636: LDPA/LDAPS
• 88 – 464: Kerberos
• 53: Bind
UDP Ports:
• 88 – 464: Kerberos
• 53: Bind
• 123: ntp
Finish firewall configuration and reload with the following. These commands are used to allow FreeIPA services in the case the the security daemon Firewalld is running on your system. If it is not running, you can skip this step.
firewall-cmd --permanent --add-service={ntp,http,https,ldap,ldaps,kerberos,kpasswd,dns}

firewall-cmd --reload
After allowing traffic for the above ports, next use authconfig to make sure that home directories are created using:
authconfig --enablemkhomedir --update
To enable SSSD, short for System Security Services Daemon, to run on boot as well as start it, use the following commands:
chkconfig sssd on

service sssd start
As a last step, reboot your server.
You can verify that everything is working as it should by trying to access your interface after completing the above steps. You can access the interface using the login admin and password that you set during the installation. Don’t forget to replace the tutorial IP address with your own:
https://10.10.0.35
Here after log in, have a look around!
Completion of this guide means that you are now able to install FreeIPA on your system, configure it to run, and start benefitting from its security features. More detailed information about FreeIPA can be found online to further customize this security suite solution, but if you found this tutorial about the basics helpful, why not share it with your friends? Everyone can benefit from enhanced security.
Zabbix is an enterprise-class open source network monitoring solution. If you have something in your network that you’d like to keep track of, Zabbix can monitor it without requiring a separate solution for each type of resource. It can track characteristics of hardware, such as CPU utilization and bandwidth use. Zabbix monitoring can also perform health checks on web and other applications, ensuring that they are still running and responding to requests in a timely manner. All of this is provided entirely free of charge on an open source platform, ensuring that small and large organizations alike can enjoy the same rich monitoring solution.
This guide will set up the Zabbix monitoring agent on your CentOS 7 server. Agents are installed on the servers you want to monitor, and their reports are integrated on a central Zabbix server for easier review and analysis. You can also run the agent directly on the Zabbix server, though for best results these machines should be separate so Zabbix can report when a server has failed.
Confirm that you have the following before you follow this guide:
• 1 Node (Cloud Server or Dedicated Server) running CentOS 7.
• Root access to the node or one sudo non-root user
Begin by installing the Zabbix package repository. This will not only let you install the Zabbix agent using the Yum package manager, but you’ll also be able to easily apply updates in the future.
rpm -ivh http://repo.zabbix.com/zabbix/3.0/rhel/7/x86_64/zabbix-release-3.0-1.el7.noarch.rpm
With the repository installed, we can now install the package for the Zabbix agent.
yum install -y zabbix zabbix-agent
The agent should be installed, but it needs a server to which to send its metrics and other performance data. Here we’ll configure the agent to communicate with your Zabbix server.
nano /etc/zabbix/zabbix_agentd.conf
Server=123.123.123.2

Hostname=zabbix1.globo.tech
In the above configuration, 123.123.123.2 is the IP of your Zabbix server. “Hostname” is the name of the client’s host on which the agent is being run. This name will be used to identify the server being monitored in Zabbix’ reports.
In order for the Zabbix agent to begin monitoring, we’ll need to start it. You’ll probably want monitoring to continue through reboots, so we’ll also enable the Zabbix agent service to launch when your server boots.
systemctl start zabbix-agent.service

systemctl enable zabbix-agent.service
The Zabbix agent is now monitoring this server’s resource use, and is sending its reports to the Zabbix server. You can repeat this process across a whole fleet of servers, and easily monitor them all from the Zabbix server node. Share this article with anyone you know who is looking for a good resource monitoring system.
The Zabbix software package is a highly customizable and flexible server- and software-monitoring tool. A single instance of Zabbix on a server can be used to gather accurate statistics and performance data on multiple physical or virtual servers. Zabbix may also be used to monitor any device with an SNMP agent such as routers, switches, and even some cooling and power systems. When installed on a monitored server, Zabbix agent makes a vast array of data available for monitoring, including CPU load, memory usage, disk space, network load, and active processes. Zabbix can use HTTP/SNMP to retrieve basic monitoring information from other servers without installing any software on those hosts. Data collected by Zabbix are stored in a relational database for easy retrieval and ready analysis. In this tutorial, we will show you how to install Zabbix on CentOS 7 using MariaDB as our database backend.
Confirm that you have the following before you follow this guide:
• 1 Node (Cloud Server or Dedicated Server) running CentOS 7.
• Root access to the node or one sudo non-root user
Before you start to install Zabbix, make sure that SELinux is disabled.
setenforce 0

sed -i 's/enforcing/disabled/' /etc/sysconfig/selinux

sed -i 's/enforcing/disabled/' /etc/selinux/config
The EPEL repository contains packages upon which Zabbix is dependent. Use Yum to install these packages as follows:
yum install -y nano wget
All dependencies should now be installed.
Add the Zabbix repository to your instance of Yum:
rpm -ivh http://repo.zabbix.com/zabbix/3.0/rhel/7/x86_64/zabbix-release-3.0-1.el7.noarch.rpm
Zabbix has no capacity for data storage or analysis. Rather, it feeds all the data it retrieves to a relational database backend. We will use a fork of MySQL called MariDB as our backend in this tutorial.
To install MariaDB Database Server use Yum as follows:
yum install -y mariadb mariadb-server
To assure monitoring data collected by Zabbix is collected whenever the server is running, we will make MariaDB available immediately whenever the CentOS server restarts. To make it so execute the following commands:
systemctl start mariadb.service

systemctl enable mariadb.service
As a variant of MySQL, MariaDB is not inherently secure. The following commands will secure your database server and set your root password:
mysql_secure_installation
Zabbix will require its own dedicated database within your newly running and initialized instance of MariaDB. We recommend you create a unique user within MariaDB that uniquely has access to that database. To create the database and user for Zabbix enter these command, replacing “zabbixpassword” with your own secure password:
mysql -u root -p
create database zabbix character set utf8 collate utf8_bin;

grant all privileges on zabbix.* to zabbix@localhost identified by 'zabbixpassword';

exit
User : zabbix – Database : zabbix – Password : zabbixpassword
Now that the database is prepared, install Zabbix server with the correct MariaDB support packages as follows:
yum install -y zabbix-server-mysql zabbix-web-mysql
Import the contents (schema, images, and data) of the default database provided by Zabbix into your database server ( version installed here : 3.0.4 ):
cd /usr/share/doc/zabbix-server-mysql-3.0.4/

gunzip create.sql.gz

mysql -u root -p zabbix < create.sql
Zabbix server is installed and the database is properly configured. We are ready to configure PHP and the HTTP (Apache) server to work with Zabbix.
The default settings for a number of PHP parameters will not interact well with Zabbix. To maximize performance, open your php.ini file with a text editor (we use nano) and modify those lines with the parameters described in the following so that they have the values depicted there:
nano /etc/php.ini
max_execution_time = 600

max_input_time = 600

memory_limit = 256M

post_max_size = 32M

upload_max_filesize = 16M

date.timezone = America/Toronto
Don't forget to remove the comment in front of date.timezone.
Next, you need to tell the HTTP server how to access the zabbix database you created above. Find the line in the configuration file /etc/zabbix/zabbix_server.conf that corresponds to the database password you set above and add the correct value:
nano /etc/zabbix/zabbix_server.conf
When Yum installed Zabbix, it created the file /etc/httpd/conf.d/zabbix.conf. Edit this Zabbix configuration file so that it looks like this:
DBHost=localhost

DBName=zabbix

DBUser=zabbix

DBPassword=zabbixpassword
To use Zabbix restart your web server. If the HTTP Server has not been configured to launch when the CentOS server boots, use the following command to enable that behavior:
systemctl restart httpd.service

systemctl enable httpd.service
With the HTTP Server running, start the Zabbix server service and set it to start on boot:
systemctl start zabbix-server.service

systemctl enable zabbix-server.service
Zabbix is now available on your server.
You may finish your setup online by going to:
http://your_ip/zabbix
Replace your_ip with the IP address of your server. Click next repeatedly until you are prompted to enter the configuration data for the DB connection. Fill in the database information, using the parameters you defined earlier. Then continue to click through until installation is finished.
Use the default login information to log into your control panel
Login : Admin

Password : zabbix
Zabbix is installed and configured.
You have successfully installed Zabbix on a CentOS 7 server. With the MariaDB backend in place, you are ready to monitor all of your servers from one central location. If you liked this Knowledge Base article please share it with your friends.
If you found this article helpful, feel free to share it with your friends and let us know in the comments below!
Hard drive performance is often a bottleneck when diagnosing why a server may be running more slowly. Maybe a program is performing lots of writes, or numerous swap hits are causing performance to degrade. Regardless of the cause, iotop is a critical tool in determining if excessive disk access is degrading server resources. In this guide, we’ll install iotop on CentOS 7, and will introduce its use so you’ll know how to instrument production servers.
To complete this guide, you will need the following:
• 1 Node (Cloud Server or Dedicated Server) running a clean CentOS 7.
• Root access to the server.
While it will work on a production server, it is recommended that you familiarize yourself with iotop on an instance that isn’t critical to your operations before using this knowledge on a live system.
Let’s begin. The iotop package is included in the official CentOS 7 package repositories, so we only need to install it.
yum -y install iotop
Now we run the newly-installed iotop command, at which point we’ll get regularly updated statistics on disk use.
iotop
At the moment the iotop results aren’t terribly interesting. If you’ve followed this guide’s recommendation, you’ve installed it on a server that is mostly idle.
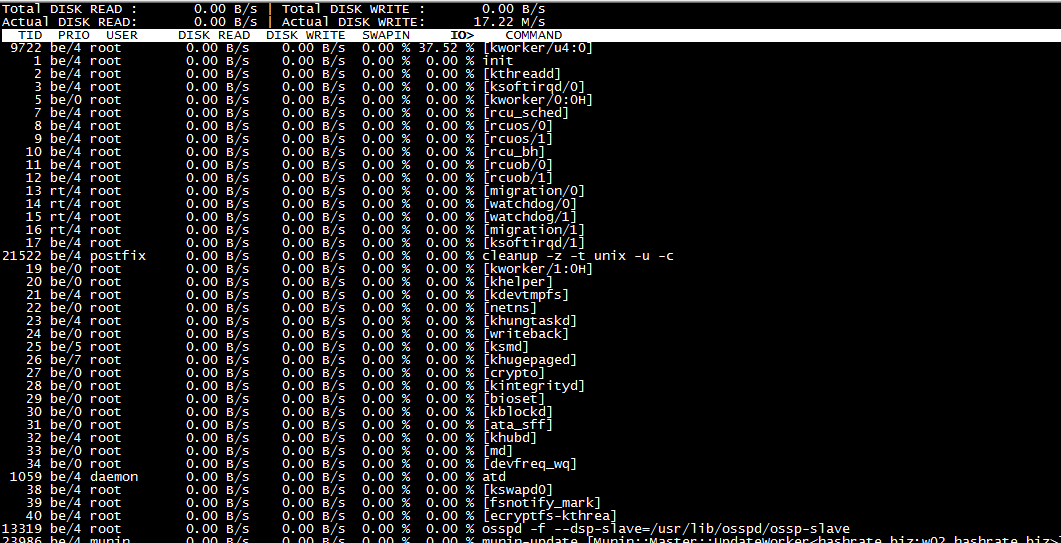
If an application is performing many disk reads or writes, you’ll notice it at the top of the list. You can use the IO percentage value to determine a program’s disk access as it relates to total drive bandwidth. If a program is behaving badly, there may be configuration tweaks that can be made to reduce its disk use, perhaps making it rely more on RAM.
The SwapIn column lets you determine how much a given process is hitting swap. This may be an indication that the process’s memory use should be reduced somehow. While it would still be writing to disk, letting a process persist storage using its own mechanisms is likely faster than having it page memory in and out of swap.
If the current iotop display is too coarse, there are ways to run it that display more precise details. For instance, maybe you only want global disk usage data. The following command accomplishes this:
root@iotop:~# iotop -btoqq --iter=1
17:53:54 Total DISK READ :       0.00 B/s | Total DISK WRITE :       0.00 B/s

17:53:54 Actual DISK READ:       0.00 B/s | Actual DISK WRITE:       0.00 B/s
You can also run iotop with multiple iterations. This gives you more snapshots of disk usage, giving a more accurate picture of how disk bandwidth is being used.
root@iotop:~# iotop -btoqq --iter=5
17:55:00 Total DISK READ :       0.00 B/s | Total DISK WRITE :       0.00 B/s

17:55:00 Actual DISK READ:       0.00 B/s | Actual DISK WRITE:       0.00 B/s

17:55:01 Total DISK READ :       0.00 B/s | Total DISK WRITE :       0.00 B/s

17:55:01 Actual DISK READ:       0.00 B/s | Actual DISK WRITE:       0.00 B/s

17:55:02 Total DISK READ :       0.00 B/s | Total DISK WRITE :      98.57 K/s

17:55:02 Actual DISK READ:       0.00 B/s | Actual DISK WRITE:     220.79 K/s

17:55:02   142 be/3 root        0.00 B/s   55.20 K/s  0.00 %  0.20 % [jbd2/sda3-8]

17:55:02 21522 be/4 postfix     0.00 B/s    3.94 K/s  0.00 %  0.06 % cleanup -z -t unix -u -c

17:55:02 23849 be/4 postfix     0.00 B/s    0.00 B/s  0.00 %  0.00 % local -t unix

17:55:02 31183 be/4 mysql       0.00 B/s   11.83 K/s  0.00 %  0.00 % mysqld

17:55:02   470 be/4 syslog      0.00 B/s   19.71 K/s  0.00 %  0.00 % rsyslogd [rs:main Q:Reg]

17:55:03 Total DISK READ :       0.00 B/s | Total DISK WRITE :     772.34 K/s

17:55:03 Actual DISK READ:       0.00 B/s | Actual DISK WRITE:     985.80 K/s

17:55:03 12082 be/4 nagios      0.00 B/s  461.85 K/s  0.00 %  0.20 % nagios -d /usr/local/nagios/etc/nagios.cfg

17:55:03   142 be/3 root        0.00 B/s  252.27 K/s  0.00 %  0.05 % [jbd2/sda3-8]

17:55:03 31215 be/4 mysql       0.00 B/s   58.22 K/s  0.00 %  0.00 % mysqld
You can also have iotop only report an application if it is using an excessive amount of resources. This filters out apps that aren’t likely to be causing issues. If an app begins using large amounts of resources, it will appear in iotop’s output.
Similarly, you can have iotop only output the top applications currently consuming disk bandwidth. This command takes five samples of disk usage, displaying only the top applications that are hitting the disk.
root@iotop:~# iotop -botqqq --iter=5
17:59:50 24333 be/4 root        0.00 B/s    0.00 B/s  0.00 %  0.48 % [kworker/u4:2]

17:59:51 12082 be/4 nagios      0.00 B/s    3.91 K/s  0.00 %  0.00 % nagios -d /usr/local/nagios/etc/nagios.cfg

17:59:52   142 be/3 root        0.00 B/s   66.50 K/s  0.00 %  0.31 % [jbd2/sda3-8]

17:59:52 12082 be/4 nagios      0.00 B/s  465.48 K/s  0.00 %  0.16 % nagios -d /usr/local/nagios/etc/nagios.cfg

17:59:52  5604 be/4 postfix     0.00 B/s    3.91 K/s  0.00 %  0.00 % tlsmgr -l -t unix -u -c
If you know that disk use on your server is heavy but can’t watch iotop constantly, it can be used to output a log of disk use in the background. The log can then be checked later to identify problematic applications. This command will log iotop output for later analysis:
crontab -e
When editing your crontab, add the below line. Edit the line to suit your needs. This example logs only certain applications for later investigation.
* * * * * root iotop -botqqq --iter=3 >> /var/log/iotop
Save this file and wait a minute for it to run. You’ll see logs in /var/log/iotop.
Iotop is a complex tool with many possible uses, but it is invaluable in determining whether disk access is causing performance issues on your server. The above should help you both identify individual issues, as well as set up longer-term performance monitoring to spot intermittent disk usage spikes that might hobble your server. If this guide was helpful to you, kindly share it with others who may also be interested.